

Uncertainty is faced by every organization irrespective of its size and industry. A supplier may fall behind on the delivery. During the peak production time, a piece of equipment may fail. A new employee could miss a safety procedure. The issue is not if there are risks, but if you can sense them, and take proactive action to prevent them from truly harming your business.
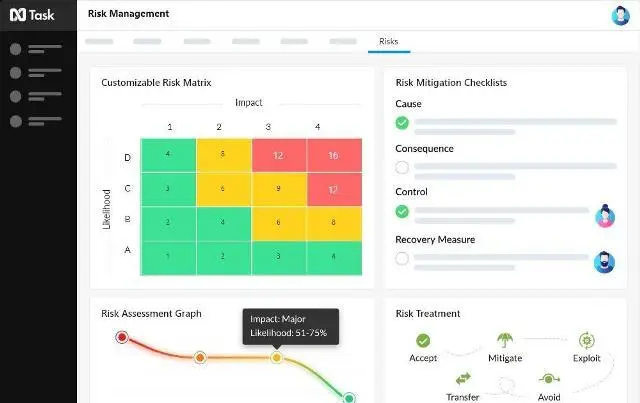
A risk assessment matrix does just that. A very simple tool, a grid which presents the probability of a risk occurring and the consequences of that risk should it happen. The simplicity hides one of the most popular decision-making frameworks in project management, workplace safety, finance, and healthcare and IT security.
As an IT professional, I’ve been on the same team as safety officers, project managers, and compliance teams have used this very tool to determine where to invest the precious time and money that they have to spend. Some things I learned are that the scoring model itself was easy to draw, but it is the honest and consistent use of the framework! The guide covers how to create, implement and sustain a risk prioritization framework that enhances the decision-making process and isn’t just a pretty picture in a compliance binder.
What is a Risk Assessment Matrix?
A risk assessment matrix is a visual tool, which can be used by a team to assess and prioritize risks by taking into account two aspects: 1) the probability of an event occurring and 2) the severity of the event if it does happen. The outcome is usually presented in a grid, usually colour coded (green, yellow, orange, red) to give the decision maker a clear indication of which risks require immediate attention and which can be managed over time.
Imagine a triage for uncertainty. An ER is not a first come, first served service — they treat the sickest patients first. Similarly, this scoring model can be used to prioritize organizational threats: when there’s a problem that is the loudest on the ground, you don’t necessarily need to respond to it; you’ll respond to the problem that has the highest combined threat.
Depending on the industry, the tool is referred to as a probability impact matrix, risk rating matrix or risk heat map. The names differ but the reason remains the same for each sector.
Why the Matrix Matters More Than Ever
Today’s companies operate with more moving parts than ever before, from a distributed workforce to interwoven supply chains, cybersecurity risks and ever-changing regulations from year to year. If risks are not evaluated against other risks, it’s likely that teams will catch themselves in one of two ruts: either they run out of resources trying to deal with all the risks as emergencies, or they ignore minor risks until they multiply into serious problems.
A healthy evaluation matrix helps to hold both extremes at bay. It makes a team think twice on each risk identified: How likely is this really to occur? and How bad would it be if it did occur? You get a lot done in effective risk management with those two answers, if you tell the truth.
The following list outlines the Core Components of a Risk Assessment Matrix:
It is useful to have some idea of the elements that enable the framework to work before constructing one of your own.
Likelihood (Probability)
This axis is indicative of the likelihood that a given risk event will happen over a period of time. Likelihood is typically presented as a scale (usually three, four or five tiers) from “rare” to “almost certain.”
In a warehouse, for instance, a forklift collision may be considered “possible” if there are incidents in the past, congestion in aisles and insufficient driving skills of the driver. For purposes of IT security, the chances of a phishing attack succeeding could be assigned a rating of “likely” based on threat intelligence data.
The severity (Impact or Consequence)
This is the measure of the severity of the risk’s consequences if they actually occur. The severity can be measured in various ways – from financial loss, to safety impact, to reputational damage, to legal exposure, to operational downtime.
A small software bug could be critical, as it could be troublesome to a few users. A compromise of customer payment information would be assigned a severity rating of “severe” or “catastrophic” due to legal, financial and reputational ramifications.
The Risk Score
Combining likelihood and severity by multiplication (or other means) then yields a risk score which indicates where a given risk lies on the grid. In general, most organizations will use a numerical rating system (1-5, 1-5, etc.) with a combination of a “4” for likelihood and a “5” for severity yielding a score of 20, which will put it in the highest priority zone.
Color Coding (Risk Tolerance Bands)
After scoring has been completed, scores are categorized into bands which are generally represented by color:
- Green (Low): Low risk, monitor regularly.
- Yellow (Moderate): Needs attention and documented mitigation plan.
- Orange (High): Urgent attention and senior supervision is required.
- Red (Critical/Extreme): requires immediate action – may include executive or regulatory action.
This color coding makes the evaluation matrix such a valuable way to communicate in meetings and reports; it’s the visual clues that convey the organization’s exposure.
There are several different types of Risk Assessment Matrices.
No single type of framework is suitable for all organizations. The appropriate format will vary by the nature and complexity of your risks and by the industry in which you work and its means of risk communication.
3×3 Risk Matrix
A simplified version with three levels of likelihood (low, medium, high) and severity (low, medium, high). Can be used for projects that have a simple quantitative risk analysis or for smaller teams. It is easy to construct and comprehend for non-experts, but not much finesse — several very different risks can be lumped into the same “medium” category.
5×5 Risk Matrix
The most popular format used in professional risk management. A 5×5 grid has five levels of likelihood (rare, unlikely, possible, likely, almost certain) and five levels of severity (negligible, minor, moderate, major, catastrophic) resulting in 25 risk combinations. This granularity allows a much clearer understanding of the distinction between risks that may be combined together in a simpler matrix.

Many organizations that are committed to standards such as ISO 31000 (the internationally recognised risk management framework) will choose to work within the 5×5 format as it ensures there is sufficient detail and/or usability.
3×3 vs 5×5: Quick Comparison
| Feature | 3×3 Matrix | 5×5 Matrix |
|---|---|---|
| Likelihood levels | 3 (low, medium, high) | 5 (rare, unlikely, possible, likely, almost certain) |
| Severity levels | 3 (low, medium, high) | 5 (negligible, minor, moderate, major, catastrophic) |
| Total risk combinations | 9 | 25 |
| Best suited for | Small teams, simple projects, quick decisions | Complex organizations, regulated industries, enterprise risk programs |
| Ease of use | Very easy to build and read | Requires more setup and training to use consistently |
| Precision | Lower — dissimilar risks can land in the same category | Higher — finer distinctions between risk levels |
| Common standards alignment | Informal use, small business | Often aligned with ISO 31000, NIST SP 800-30 |
Qualitative vs Quantitative Matrices
A qualitative risk analysis involves the use of descriptive terms (low, moderate, high) which are derived from expert judgement, historical trends and the skill of the team. It’s easier to put into practice and effective when there isn’t much hard data available.
A quantitative grid, on the other hand, rates the dollar value impact and the probability of each risk, which can be statistically modeled or be based on previous loss experience. This requires more time and data maturity and yields more accurate prioritization, which is often preferred by larger companies with in-house risk teams.
Many organizations begin their data collection process with qualitative data and transition to quantitative data as they develop — don’t fear starting simple!
Creating a Risk Assessment Matrix (RAM) follows a sequence of steps. Building a Risk Assessment Matrix (RAM) is a series of steps.
This is a process I’ve seen work in every industry from workplace to project to IT governance.
The first step is to identify the risks. Step 1 is to identify the risks.
To plot something, you must have a list of possible risks. This is based on brainstorming, incident logs from the past, industry standards, audits and direct feedback from front line staff who are more likely to see hazards which are not noticed by leadership. For instance, a construction site supervisor will likely be the first to become aware of problems regarding the wear-and-tear of equipment before such issues would be reported to a corporate risk report.
Write each risk down in terms that are clear — general risks such as “equipment problems” can’t be acted upon. However, compose something specific: “Conveyor belt motor in Bay 3 may overheat if used for prolonged periods of time.”
In Step 2, you will determine your scales for likelihood and severity.
Decide the number of levels you will have (3, 4 or 5) and what each level will look like in your context. This step is often omitted, and is why many matrices fail. Inconsistent team members definitions for “likely” will not lead to comparable scores throughout the organization.
For instance, not “pretty often” – “likely” could mean “expected to happen several times/years”.
Assign a score to each risk (Step 3).
Give a probability rating and a consequence rating to each risk identified. It’s also best approached as a group activity, as it’s not wise to rely solely on management perspective as people on the front line have much more insight into the details which might not be noticed from a distance.
Step 4: Plot Risks on the Matrix
Write each risk in the corresponding cell of the grid according to the total score. This visual mapping will immediately identify clusters, such as finding that multiple, un-related risks are all linked to the same root cause, such as a lack of staff training.
Step 5: Prioritize and assign ownership
Documented action plans and named owner responsible for follow through for risks in red or orange zones. Even if the framework is well constructed, it’s a static document that no one takes any action on without ownership.
Once you have finished the steps listed above, you should review and update your document routinely.
Risk isn’t static. Risk is continually changing as new regulations, market changes, staffing, and technology improvements all affect your risk environment. The majority of the mature organizations conduct reviews of their scoring model on a quarterly basis, and extra reviews are conducted when there are major incidents, new projects or key changes to the operations.
Using the Risk Assessment Matrix in the real world
Project Management
In project risk management, the team applies the framework to foresee delays or overruns in the schedule, resources or the scope of the project. A project manager involved in implementing a software system could consider the risk of “key developer resignation” to be moderate likelihood and high severity, and therefore could take action for cross training as a mitigation strategy before the risk even becomes real.
Ensure workplace health and safety. Ensure workplace health and safety.
The evaluation matrix is an important tool for safety officers to fulfil their occupational health and safety commitments. It could be employed in a manufacturing facility to evaluate machinery risks, chemical exposure risks or ergonomic strain injuries, matching priorities for risk mitigation with regulations like OSHA machine safety requirements in the United States or similar regulatory bodies in other countries.
Financial and Enterprise Risk Management
In enterprise risk management, this scoring model can be used to compare and contrast market risk, credit risk, regulatory risk and reputational risk. This enables leadership to determine where budget should be spent for risk mitigation purposes to have the most impact, instead of being spread thin among all possible concerns.
Cybersecurity
IT security teams use the same approach with threats such as software vulnerabilities that have not been patched, insider threats or phishing campaigns. The higher the vulnerability and easy to exploit, the higher the priority for patching, especially if it’s to a sensitive system.
Healthcare
Risk grids are used at hospitals and clinics to assess patient safety issues, ranging from medication administration errors to infection control issues. Healthcare providers tend to be more conservative in their severity assessments which, especially when the impact of the event is serious, should be taken seriously even if the likelihood is considered “unlikely.”

Mistakes that are often made
After seeing many risk grids in a variety of organizations I’ve found there are some common pitfalls.
Vague scoring criteria. If there are no definitions for each likelihood and severity level, it is at risk of being unreliable because various team members will evaluate the same risk in the same manner.
Considering the framework as a ‘one shot’. Risk assessment is not a once-a-year audit, but the constant and ongoing process. The risks can also rapidly change, and a scoring model created in January could be very out-of-date by June.
Failure to take on high threat, low probability risks. It is easy to concentrate on small, but frequent and severe risks, since they might feel more “real.” Yet when a catastrophic event occurs, such as a major data breach, a chemical spill, a critical system failure, then it is a serious time to go ahead and make a serious plan for mitigating the effect of the event, because it can be existential.
Overcomplicating the scale. Others create grids that are too hyper-specific (10×10 matrices, say), which overcomplicates the user experience, and leads to slower decision-making and can have a negative impact on accuracy.
No action taken on identified risks. If the grid is crammed with red flagged risks with no one assigned to the risk or action plan, then it’s not risk management — it’s just documentation. It is not the assessment itself that is the value, but what happens following the assessment.
Recognize and apply industry standards and frameworks behind the framework
The risk assessment matrix is not an end in itself but is part of the wider risk management frameworks organizations apply in managing their risk.
The ISO 31000 is the overall international standard for risk management, which is used the most. It does not require a particular grid structure, but outlines the principles that most matrices are based on — recognising context, evaluating risk, risk treatment, and tracking of risk outcomes. Organizations that use grids based on ISO 31000 principles are more likely to create defensible, auditable risk documentation, which is important when regulators and/or insurers ask questions.
Project Management Institute’s PMBOK Guide applies the same approach to risk assessment as it does to all other aspects of project management; it considers it to be a fundamental part of project planning, and suggests the same grid approach as described here. Anyone looking to become a PMP certification will know this tool instantly as it’s a common part of the PMBOK Guide risk management knowledge area.
For IT and cybersecurity teams, there are frameworks that provide in-depth guidance for gauging threat likelihood and impact to information systems, such as NIST SP 800-30 published by the U.S. National Institute of Standards and Technology, which often scores vulnerabilities and remediation efforts in a grid format.
In the U.S. OSHA specifically mentions risk grids as a valid approach to establishing a company has taken “reasonably practicable” measures to identify and control hazards in workplace safety. This is why the evaluation matrix continues to be used in safety-critical sectors: it provides an audit trail and defensible approach that can be documented, and not downplayed as the risks have been thought through in a systematic way.
Not all of these require you to use the vocabulary or scales of these frameworks, but they are useful to help create a scoring model that is likely to pass the test of internal audit, review by a client contract, or regulatory inspection.
Selecting the appropriate tools for the appropriate risk grid.
Smaller groups will begin with a spreadsheet, which is a totally OK and normal beginning. Most of what a small business or single-project team will need is covered by a simple colour coded grid in Excel or Google Sheets, with conditional formatting to automatically ‘colour code’ the cells based on their scores.
The more departments are engaged in the risk management process, the more useful it is to have dedicated risk management software. These platforms can include capabilities that are difficult to replicate with spreadsheets such as automated calculation of risk scores, tracking historical trends, providing links to incident reporting systems and providing functions for regulators or insurers to request an audit. These types of software are commonly called governance, risk and compliance (GRC) platforms or project risk modules that are already integrated in products such as Microsoft Project or Smartsheet, and even specialized safety management software in construction and manufacturing.
The important factor is not size of the company, it is complexity. A spreadsheet could be all that a five-person consultancy will ever need. A health care system that is managing the safety of its patients, regulatory compliance and facilities risk at multiple sites will surely require something more substantial. Regardless of your selected option, the rationale behind likelihood times severity remains constant — only this time, it’s automated.
A case study: The Framework in a small manufacturing plant.
To illustrate this, let’s imagine that a mid-sized manufacturing site is evaluating risk before the annual safety audit.
Members of the safety committee suggest a number of candidate risks: An aging forklift with worn brake pads, inconsistent use of hearing protection when working near the stamping machines, a chemical storage room that doesn’t have up-to-date ventilation, and a data backup system that hasn’t been tested in more than a year.
Utilizing a 5×5 grid, the team rates the forklift issue as likely (Level 4), meaning that there have been reports of near misses in the past, and as major (Level 4), indicating that there could be serious injury, giving the team a score of 16 or in the orange zone. The hearing protection issue is rated “almost certain” (number 5) due to frequent nonuse as revealed by compliance checks, but is rated “moderate” (number 3) due to the fact that damage to the hearing from short exposures is less immediate and less severe, resulting in an orange score of 15.

The chemical storage ventilation issue has a score of “possible” (level 3) and a severity rating of “catastrophic” (level 5), making a combined score of 15 for chemical storage ventilation, due to the risk of toxic exposure. The untested data backup system has an “unlikely” rating (level 2) and “major” severity (level 4), with a score of 8 indicating that it is in the “Yellow” zone.
In this exercise, the plant’s priorities change. The team could have begun with the data back-up, since it was the latest of the items in a meeting. The scoring model makes it obvious that the forklift hazard, hearing protection and chemical ventilation all require slightly earlier, more resource-intensive response; the backup hazard need not be addressed as urgently, but should still be addressed sooner rather than later. This is what the framework does, it reveals and defends hard choices.
Bringing the Framework into other aspects of risk management
A risk assessment matrix should be seen as part of a broader and continuous risk management cycle and is not a one-off activity that is completed and then forgotten.
Usually, there are four related phases in that cycle. The identification of risks involves collating threats identified through audits, past incidents, staff feedback and industry research. The scoring model scores and prioritizes those threats in risk assessment. Decision making on risk treatment means determining what to do with risk. Monitoring and review are used to close the loop to see if treatments are effective and if there are new risks that have arisen.
Risk Response Table
| Response | What It Means | Example |
|---|---|---|
| Eliminate | Remove the risk entirely by stopping the activity or process that causes it | Retiring an aging forklift instead of continuing to repair it |
| Reduce | Apply controls to lower the likelihood or severity of the risk | Adding ventilation to a chemical storage room to cut exposure severity |
| Transfer | Shift the risk to another party, typically through insurance or contract terms | Purchasing cyber-liability insurance to cover data breach costs |
| Accept | Acknowledge the risk and take no further action, usually because it is low priority or the cost of treatment outweighs the benefit | Accepting a rare, low-severity software bug that affects a handful of users |
If you miss one of these stages, then the entire system becomes fragile. A scoring model with no follow-up treatment plans is simply a color chart. Treatment plans that go without monitoring would leave organizations blind on whether their mitigation efforts worked or not. This is the power of the framework; it exists within this larger discipline, it is spread out and disconnected and becomes a structured and repeatable process that lives through the constant changes in staffing, priorities and the tendency for urgent, but less important, work to become more pressing than long-term risk planning.
What is the difference between Risk Assessment Matrix and Risk Register?
It’s easy to mix up these two tools as they can be quite different. A risk register is a log, a running database that tracks and describes every identified risk, who is responsible for it, whether it has been mitigated or not and when it is due for review. The risk assessment matrix, on the other hand, is a visualization tool that ranks in order of priority those risks which have been logged that need to be addressed now.
In reality, the two are used together: the register contains complete information whereas the evaluation matrix gives a quick overview of the prioritization, directing the team’s first target. Actually, each tool cannot completely substitute for the other: A register without prioritization remains a list, while a scoring model without a register doesn’t necessarily contain the necessary operational detail to ensure follow-through.
Effective Guidelines for an Effective Framework
Once the grid is built, it’s only half the battle! If it is to be useful and adaptable it must be continuously disciplined.
Involve diverse perspectives. Risks (and thus risk perception) vary from person to person in an organization. The frontline knowledge and perspective of leadership adds insight to the broader perspective that leads to more accurate scoring.
Standardize scoring from team to team. If the scoring model is used independently by the various departments, conduct regular calibration meetings to make sure that the term “high severity” has the same meaning in Finance as in Operations, for example.
Link and tie mitigation plans to measurable actions. Don’t simply put a “monitor closely” as a mitigation; each risk should have a specific mitigation, a responsible owner and a specific date for completion.
Document your reasoning. If a risk is scored, make brief notes on why this is. This helps build institutional knowledge so that future reviewers will be able to understand the context; particularly when there is a change in staff and the previous assessor is not around to provide an explanation of their reasoning.
Utilize technology as appropriate. For smaller-sized teams, a template spreadsheet can be used, but larger organizations may find it helpful to have specific risk management software, which can automate the scoring process, provide historical trends and create reports for regulators or auditors.
The Risk Assessment Matrix has certain limitations:
There is no perfect tool and it is important to be honest about this one’s weaknesses. In a qualitative format, risk grids are subjective, and even with a defined scoring criteria, results differ in the degree of subjectivity between different risk matrix assessors. These also often assume that risk of an incident is independent from its severity — two of the same issues (i.e., lack of training) could contribute to the likelihood of more than one unrelated incident.
In addition, a scoring model reduces multi-dimensional risks into a single score which may be misleading in representing a complicated situation. The framework is best used as a guide to priority rather than a definitive answer and is most useful in high-stakes situations such as major capital projects, safety-critical systems or regulatory compliance in high-risk industries. When combined with more detailed quantitative modelling (where resources permit), gives a more complete picture.
Conclusion
A robust risk assessment matrix provides teams with a clear and easy-to-visualize comparison of threats and prioritizes resources for the areas that need them most. It doesn’t remove uncertainty, although it does remove the guesswork, and provides a framework for making judgements based on the likelihood and severity of the risks. In any type of program, whether you’re tracking the progress of a construction site, the rollout of a software solution, or an enterprise-wide compliance initiative, the same rules apply: clearly establish your scales, score honestly, assign ownership and review the grid regularly. Get it simple, getting better as you get smarter, and use the framework to make more informed, quicker decisions throughout your company.
Frequently Asked Questions
Q. The primary goal of a risk assessment matrix is to:
The primary use of it is to assist teams to compare and prioritize the risks, as it helps to incorporate the likelihood of the event occurring with severity of consequences to help team members make better decisions as to where to allocate limited time and resources.
Q. Should the risk matrix be 3×3 or 5×5 in size?
A 3×3 matrix works for small teams and/or simple projects requiring quick decisions. A 5×5 matrix provides greater detail, and is suitable for those organizations with complex or many risks, like manufacturing or enterprise risk programs.
Q. When to update a risk assessment matrix?
Most organizations review the matrix on a quarterly basis, but when there are significant changes, such as new projects, regulatory requirements or operational changes, an update should be made to the matrix as this will impact the risk assessment.
Q. The relationship between a risk assessment matrix and a risk register.
No. A risk register is a detailed log of all risks that identifies the risk, owner and status of the risk and the matrix is a visual prioritization tool. They are effective when used in combination.
Q. Are small businesses able to apply a risk assessment matrix?
Yes. A basic 3×3 matrix can be useful to small businesses in determining which risks, such as cash flow shortfalls or delays by suppliers, should be addressed now, rather than over the long-term, without complex software.
Q. How many types of risk assessment are there?
Qualitative assessment relies on judgments and experience to determine ratings, such as “high” or “low.” Quantitative evaluation provides a numeric probability and cost, which is more precise but is more difficult to obtain and more time-consuming.
Q. Who will be included in a risk assessment matrix?
Effective matrices include both the front-line staff with their operational knowledge of the day to day risks and leadership with their strategic and financial perspective. When both perspectives are united, a more balanced and accurate risk scoring is obtained.
Q. If a high risk score means immediate action is required, then are there any exceptions?
Y for risks in red or high-orange risk areas, typically: significant likely impact. But the right answer is also subject to the resources at hand, the rules that the organization must follow, and the organization itself.

